The Maps Feature has evolved over times, we switched from map server to google maps to openstreetmaps/openlayers.
This page is not up to date any more and need review!
Historical overview of Maps integration in Tiki
Later on, Google Maps arrived, providing an easy to use map integration to regular web sites, even without having to manage mapping data. Thus, Google Maps specific code was added to Tiki, which was convenient for a lot of people.
Then, after a community discussion, starting in Tiki7, OpenLayers (another option was Mapstraction) was added as a native way to handle maps, which permits the use of tiles from Google Maps, Bing Maps, OpenStreetMap (which is like Wikipedia but for maps), MapQuest (which serves OpenStreetMap maps), etc.
The Cartograf project further improved maps in Tiki8, Tiki9, Tiki10 and Tiki11. Many features were added, including Street View support.
In Tiki12, all Google Maps specific code was removed in favor of using OpenLayers, so Google Maps is accessible via the OpenLayers Google Layer. In addition the Natural Access project (no longer active) added further new capabilities to upload any existing line and polygon data as files and to be able to further customise how data objects were shown on the underlying map layer.
In Tiki15 all MapServer-specific code has been removed. Also OpenLayers 2.x continues to be used for the map layer and integration with Tiki to allow editable map objects to be overlaid on the map layer but experimentation has started with the integration of OpenLayers 3.x.
In Tiki20 integration with OpenLayers 3.x and higher was improved, and more features were exposed through the corresponding PluginMap parameters, as well as adding new tilesets, some of them using vector tiles instead of just the usual raster tiles.
Map-related documentation, as of summer of 2019, still makes reference to the different historical approaches but as it continues to be improved the older methods that are no longer used will be deprecated/removed. Volunteers to help with documentation improvement : please contact marclaporte at tiki dot org
The maps feature allows you to display maps, zoom on certain areas, change layers displayed and query features. Let's have an overview.
The map
First click on Maps on the maps menu in the Main Tiki Menu:
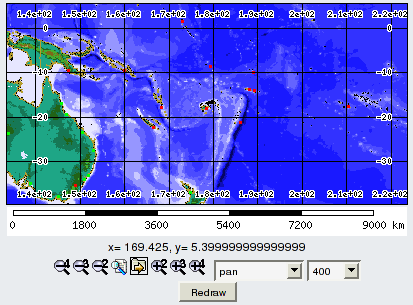
You will arrive to this page that presents you with the default map set by the site.
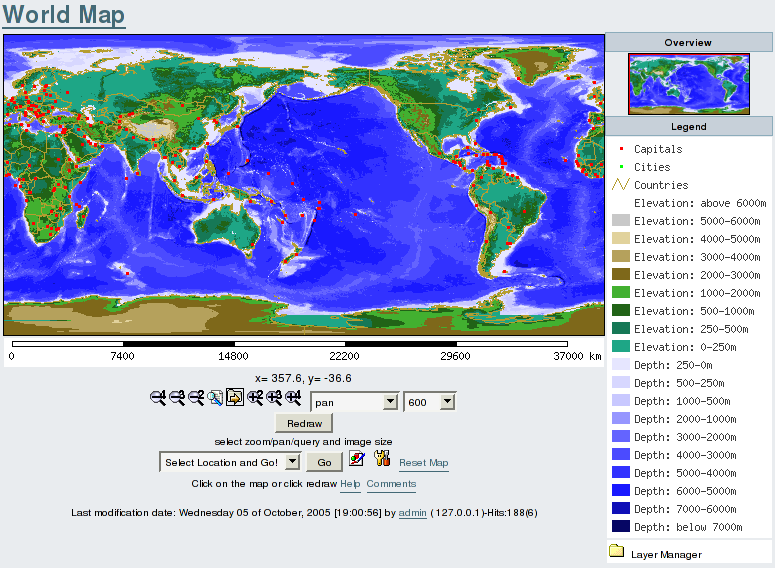
The interface is composed of several elements. The main image is your map, on the top right is the overview to show where you are in regards to the whole map. Below the overview is the legend, describing how each feature is represented on the map. Below the map is the scalebar, it will give you an indication of distances on the map. There are some other items but we will see them later.
The first technique to master is moving on the map.
Below the map you see a series of tools, these tools with their associated drop down menu allows you to zoom in, zoom out, pan and query the current map.
Let's zoom in to New Zealand.
First select the zoom in icon, let's take the one with a factor of 4:
![]() (You can also select it from the drop down menu)
(You can also select it from the drop down menu)
Then click on the map on New Zealand. The place where you click on the map will be the place at the center of the next map. This is true for all the tools. So remember, where you click is the point that will be at the center of the next map. Also, do not try to draw a rectangle or drag the image, you only click once!
You should be now there:

Let's pan to Fiji.
Select the panning tool:
![]()
As explained before, after you select this tool, you just clik on the point you would like to see in the middle of the next redraw. Consider the pan tool like a zoom tool with no zoom.
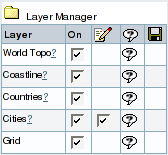
Click on the main island of Fiji, you should be here now:
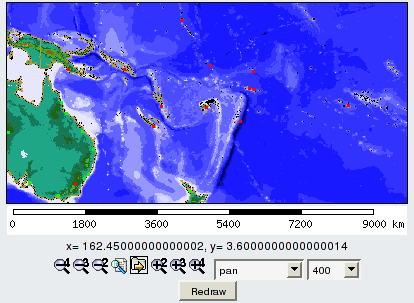
You notice that the overview image shows a red rectange where you are on the overall map. It is a convenient aid when you are a little bit lost.
let's add/remove a layer
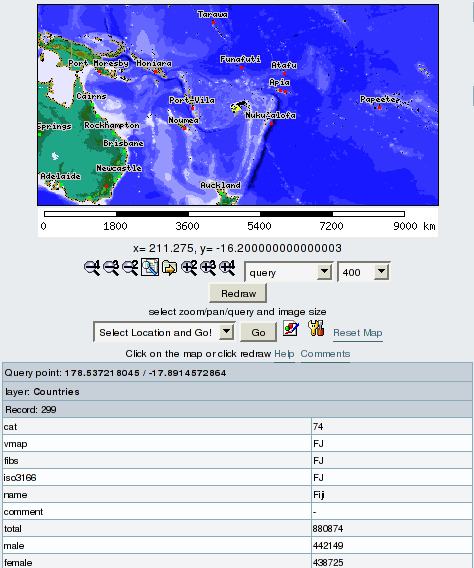
Below the llegend you have the layer manager, it could be collapsed, so your first task is to expand it by clicking on Layer Manager to reveal all the layers:
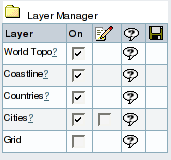
This table shows each layer name, if it is displayed or not, if the labels are displayed, if the layer is queryable and finally if you can download the raw data that makes the layer. Over your mouse on the icons in the layer manager header to see the function of each column.
You can notice that the Grid layer is not displayed, tick the grid layer on box, select the panning tool
![]()
and click on the Redraw button. You should see your map like this with a grid overlay on top.
Now on the Layer Manager again, add labels for the Cities layer and ensure that the panning tool is still selected (otherwise you will zoom in or out) then click redraw.
Your map should now be like this:
As an exercise remove the Grid Layer and redraw the map.
Querying Features
Select the query tool
![]()
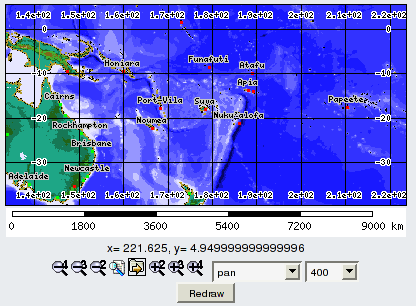
and click on any feature on the map, for instance click on the red dot for Suva, in Fiji. The selected features will be highlighted, usually in yellow and a list of attributes linked to the selected features will be displayed below the map area. Scroll down if needed.
You notice that the fist column indicates the coordinates of where you clicked then there is the list of selected features grouped by layer. You can see for instance that for the Layers Countries, the feature selected is name: Fiji and the total population is 88074.
Changing the size of the map
You can change the size of the map by selecting the desired size on the top down list. It is useful to keep a small map size when you are setting up your map, selecting the right area, with the right layers, and then redraw your map to a big size, so you can view the details and may be copy the resulting map image into your report.
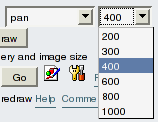
The first map on this tutorial is in fact 600 pixels wide, the other maps are 400 pixels wide, the default for this map.
Maps and Layers explained
If you click on the map title World Map you will be directed to a wiki page that will explain you everything about this map. In a same fashion, you may notice that the layers in the layer manager have a question mark after their name.
The layers have been set each to be linked with a wiki page, this page does not yet exist. If you click on the question mark you will be directed to edit this wiki page.
This is the power of Tiki to associate maps and layers with wiki pages where you can have data about the data (metadata): who created the layer, with what instrument, when was it created, what is the accuracy of the features, what do they represents,...
Tiki is therefore a Geospatial Content Management System (GeoCMS).