Plugin Chart
Introduced in Tiki2
Use this wiki plugin to display a chart from a Spreadsheet. This plugin can be generated by the TikiSheet chart tool.
Parameters
Display a chart from TikiSheet.Introduced in Tiki 2. Required parameters are in
bold.Go to the source code
Preferences required: feature_sheet, wikiplugin_chart
| Parameters | Accepted Values | Description | Default | Since |
|---|---|---|---|---|
| (body of plugin) | Chart caption. | |||
height |
digits | Height in pixels. | 2.0 | |
width |
digits | Width in pixels. | 2.0 | |
type |
Specify a valid chart type | 2.0 | ||
id |
digits | Data sheet ID | 2.0 | |
color |
text | List of colors to use. | 2.0 | |
y1 |
text | Description needed | 2.0 | |
y2 |
text | Description needed | 2.0 | |
y3 |
text | Description needed | 2.0 | |
y4 |
text | Description needed | 2.0 | |
y0 |
text | Required for types other than pie chart | 2.0 | |
x |
text | Required for types other than pie chart | 2.0 | |
label |
text | Labels for the series or values in the legend. | 2.0 | |
style |
text | List of styles to use. | 2.0 | |
value |
text | Required for pie charts | 2.0 |
Chart Types
By default, this plugin was able to display these chart types:
(taken from Spreadsheet Graphics and Charts )
Example 1
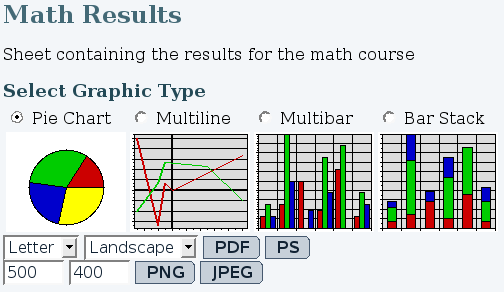
Example of Chart syntax generated through the tiki-graph_sheet.php feature (see below the parameters form and spreadsheet preview in the screenshot):

Example 2
Example of chart using Plugin Chart directly.
This code:
Copy to clipboard
{chart id="4" type="PieChartGraphic" width="600" height="400" format="letter" value="D2:D8" label="E2:E8"}
Would produce: