Spreadsheet Graphics and Charts
Graphics can be created using the Graph button in the spreadsheet view or from the sheet listing, which takes the user to tiki-graph_sheet.php?sheetId=1 (1 or the numeric id of that sheet). Two simple forms are presented to select the parameters of the graphic.
Select the Graphic Type and Output Format
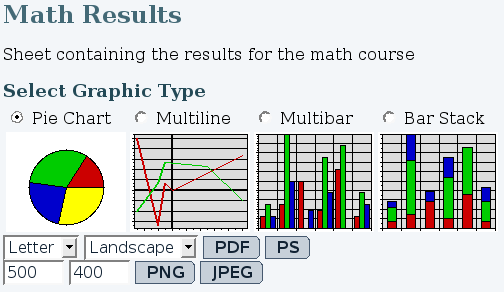
The radio buttons select the type of graphic to be generated. A first example will be made with the Pie Chart and a second one with Multibar. Multiline and Bar Stack use the same parameters as Bar Stack.
Multiple output formats are available. Depending on the installed extensions on the server, some elements might not be available. PDF and PostScript are printable format and require the paper size and orientation parameters. PNG and JPEG are images and require height and width parameters in pizels.
Parameters
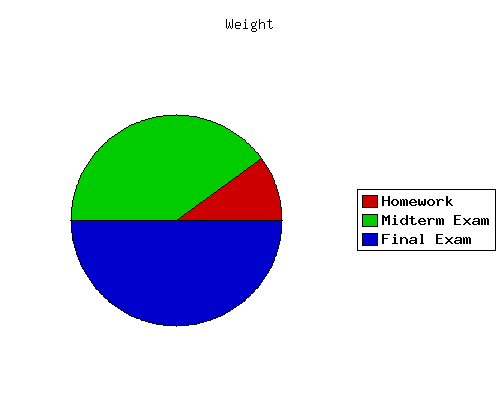
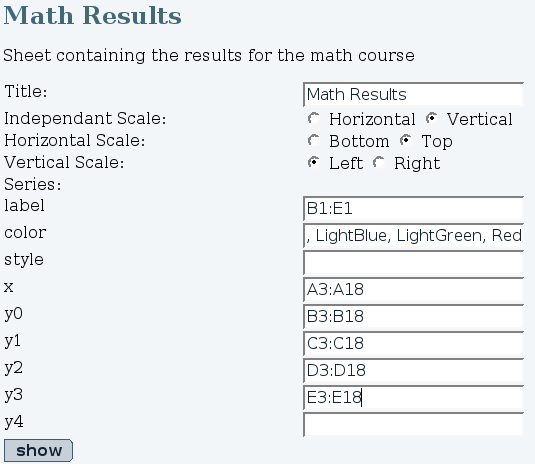
Figure 2 presents the parameters entered to obtain a pie chart from the speadsheet and Figure 3 is the result obtained. The page is divided in three sections:
- Parameter form
- Spreadsheet
- Wiki Plug-in
The parameter form is used to select the elements that will be displayed in the graphic. All parameters under the series label are value ranges from the spreadsheet in A1:Z99 format or comma seperated list of elements (ex: Blue, ))LightBlue,LightGreen((). The color and style series require special values:
Color
- Red
- Green
- Blue
- Yellow
- Orange
- LightBlue
- LightGreen
Style
- Thin-LineStroke
- Thin-FillStroke
- Normal-LineStroke
- Normal-FillStroke
- Bold-LineStroke
- Bold-FillStroke
- Bolder-LineStroke
- Bolder-FillStroke
The spreadsheet is available as a reference to select the ranges.
The wiki plug-in is updated as the parameters are changed in the form. The code displayed can be pasted in a wiki page to display the graphic. The plug-in does not consider the selected output format. Instead, it will automatically select the best format available. If possible, it will display an image and link to a printable format. Prefered image format is PNG and prefered printable format is PDF.
Pie Chart Parameters
The following table presents the different field of the form, what they are used for and the behavior if left empty.
| Title | Used as the title of the graphic | No title |
| Label | Caption in the legends | No legend |
| Value | Values used in the chart | Required |
| Color | Colors used for the elements | Automatically selected |
| Style | Change border type | Normal-FillStroke |
The amount of elements in every range must be the same.

Multibar Parameters
Figure 4 presents the parameters used to create the graphic in Figure 5. Note that different size parameters have been used to suite the large amount of data. Here is the table presenting the different parameters.
| Title | Title of the graphic | No title |
| Independant Scale | Determines if the graphic is vertical or horizontal | |
| Horizontal Scale | Location of the horizontal scale | |
| Vertical Scale | Location of the vertical scale | |
| Label | Caption of the different elements in the legend | No legend |
| Color | Colors used in the legend | Automatically selected |
| Style | Border type used | Normal-FillStroke |
| X | Independant scale range | Required. |
| Y0 | First dependant range | Required. |
| Y1-Y4 | Additional dependant range | |
The amount of elements in the Label, Color and Style ranges must be equal to the amount of Y ranges used. The amount of elements in the X range and all Y ranges must be the same.

Spreadsheet JQ Charts
Another option is to make the charts reusing the raphael.js charting library embedded in the jquery spreadsheet. See:
| Chart Type | Example | Chart | Data | Month | Year |
| Vertical Bar | "=BARCHART(D2:D13) |